Screenshots
See It in Action

Real-time analytics and visualization for your MQTTBridge data. Configurable dashboards, trend analysis, and anomaly detection — purpose-built for industrial IoT.
MQTTBridge captures every message from your MQTT brokers and RabbitMQ queues into SQL Server. But raw rows in a database don't tell you when a temperature is drifting, a sensor has gone silent, or a pressure reading just spiked. You need visibility — and you need it without building custom dashboards from scratch.
DataPulse reads directly from your MQTTBridge database and turns raw sensor data into live dashboards, trend lines, and anomaly alerts. It runs as a Windows service alongside MQTTBridge, shares the same user accounts, and is ready to go in minutes.
Drag-and-drop grid layout with multiple widgets per dashboard. Create as many dashboards as you need.
Line charts, bar charts, gauges, heatmaps, data tables, and single-value displays. Pick the right view for each metric.
Dashboards poll for new data at configurable intervals (default 5 seconds). Pause and resume anytime.
Moving averages, min/max/avg stats, and rate-of-change indicators. Spot gradual drift before it becomes a problem.
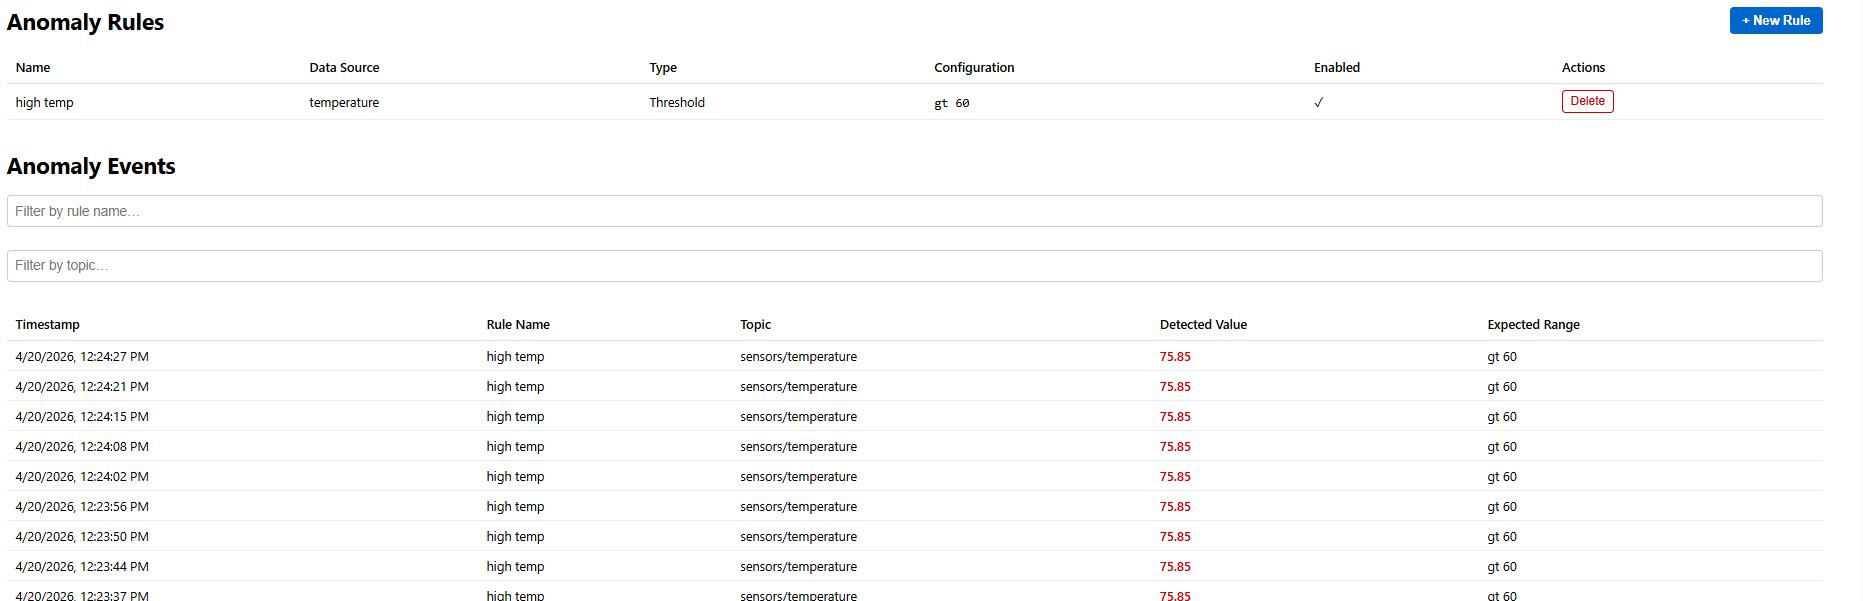
Threshold, rate-of-change, and absence-based rules. Visual highlighting on widgets plus a dedicated anomaly overview page.
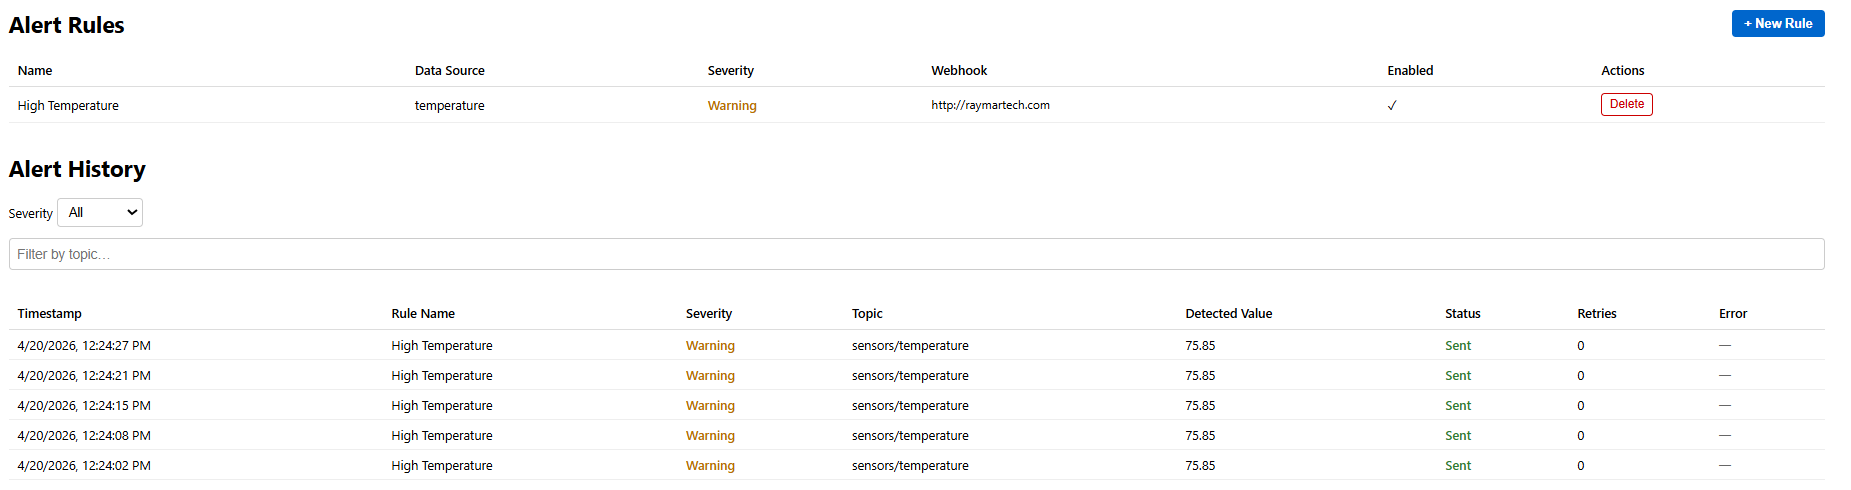
Define alert rules with severity levels. Webhook notifications with automatic retry and full alert history.
Preset ranges from 15 minutes to 30 days, plus custom date pickers. Override per-widget or apply dashboard-wide.
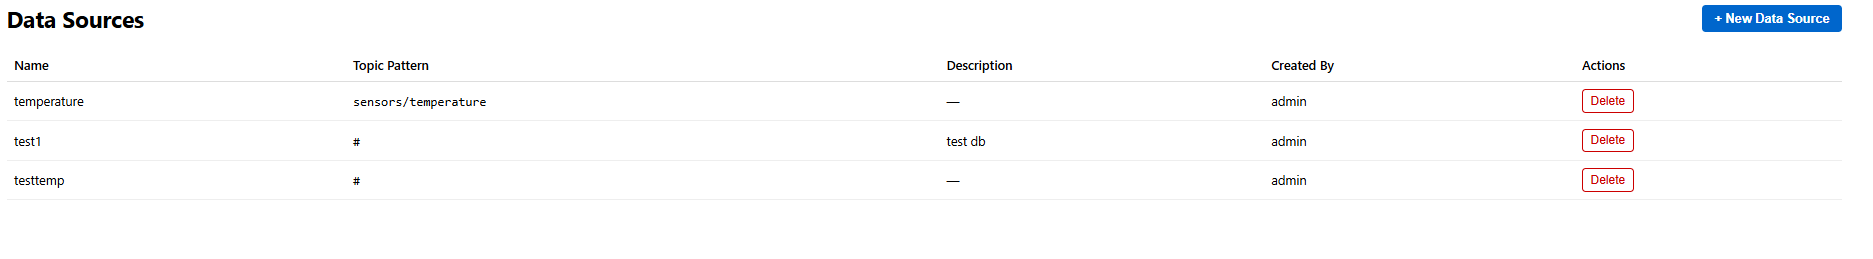
Uses the same MQTTBridge user accounts and roles. No separate credentials to manage.
Export widget data to CSV, capture dashboard snapshots as PNG, and share dashboards across your team.
Runs alongside MQTTBridge as a native Windows service. MSI installer with automatic service registration.
Reads directly from the MQTTBridge SQL Server database. No data duplication, no ETL pipelines.
Configure polling intervals, manage data sources, and monitor service health — all from the browser.
DataPulse is an add-on to MQTTBridge. If you're already running MQTTBridge, you're five minutes from live dashboards.

Run the MSI installer on the same machine as MQTTBridge. DataPulse registers as a Windows service and connects to the shared SQL Server database automatically.
Open the web interface at http://localhost:8090 and log in with your MQTTBridge credentials. Select which MQTT topics you want to visualize.
Create dashboards with drag-and-drop widgets. Choose from line charts, gauges, heatmaps, tables, and more. Arrange them in a grid layout that fits your workflow.
Define anomaly detection rules and alert conditions. Get webhook notifications when thresholds are breached, values change too fast, or sensors go silent.
DataPulse requires an existing MQTTBridge installation with an active SQL Server database.
Windows 10/11 or Server 2016+. Runs on the same machine as MQTTBridge.
SQL Server 2014 or later. Uses the same database instance as MQTTBridge.
The .NET 10 runtime is required. The installer will prompt if it's not already present.
Download the installer, connect to your MQTTBridge database, and start building dashboards.
Requires MQTTBridge · Windows 10/11 & Server 2016+ · .NET 10 ASP.NET Core Runtime · 7-day free trial
DataPulse is licensed separately from MQTTBridge. Every license includes the full service, web interface, and MSI installer. Pick a tier and get your license key — no payment required.
Download DataPulse and start building dashboards on top of your MQTTBridge data in minutes.